Template · Strategy & competition
BCG Growth-Share Matrix template
For deciding where a portfolio's cash should go, by plotting each business on market growth and market share. Leave it alone when you are one business in one market; there is no portfolio to balance. Instead Porter's Five Forces on the one business you have; a portfolio tool with one entry has nothing to say.
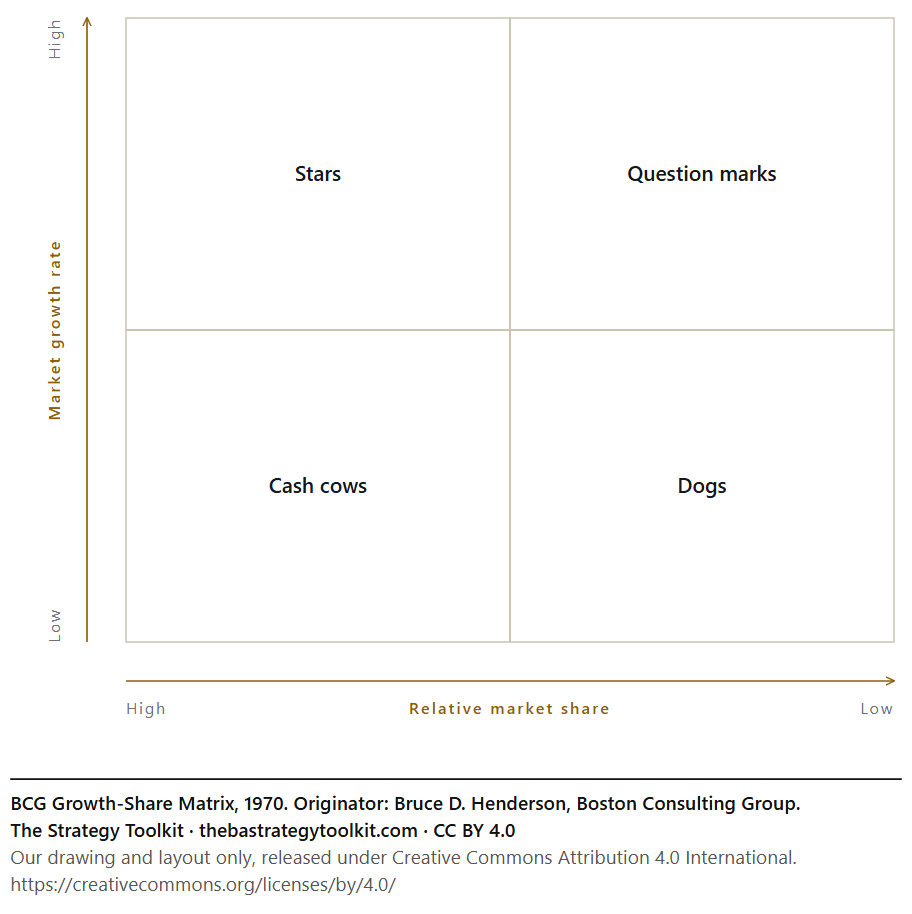
Download it
Nothing here asks for an email. The files are static and you can link straight to them.
Or work it through here
Place each business or product in its quadrant with its relative share, market growth and cash behaviour noted, then write the per-unit verdict. Your entries persist for this browser session and can be copied out as Markdown or printed.
0 of 4 blocks filled
What you may do with it
This sheet, meaning our drawing and layout of it, is released under Creative Commons Attribution 4.0 International. Use it commercially, put it in a client deck, print it for a workshop, adapt it. Keep the attribution line that is printed on the sheet and you have met the licence.
Originator: Bruce D. Henderson, Boston Consulting Group. The framework itself is not ours to license, and the written entry behind this page, its worked example, critiques and sources, stays all rights reserved. The full licence position is set out in plain English.
Before you fill it in
A blank template is the easy part. The entry behind it covers how to run BCG Growth-Share Matrix properly, a worked example, the pitfalls real teams hit, and the situations where it is the wrong tool and something else would serve better.