From Beyond AmazingLeadership coaching & consulting

The Open Library

Free strategy templates.
No sign-up.

35 business framework templates, as printable worksheets in A4 and A3, wall posters in A1 for the ones people actually put on a wall, and the diagrams themselves as vector files you can edit. Every one is blank and ready to work through.

There is no email gate on any of this. You do not have to register, and there is nothing to unsubscribe from afterwards. The sheets are released under a Creative Commons licence, which means you may put them in a client deck, print them for a workshop, redraw them in your own brand, and charge for the work you do with them. The only thing asked in return is that the attribution line stays on the sheet.

What is licensed is our drawing and our layout. The frameworks themselves belong to the people who devised them and are credited on every sheet. The written entries behind them, the worked examples, the critiques and the sources, stay on this site and are not part of the pack.

Sheets
35
Wall posters
10 at A1
Work in the page
92, 28 interactive
Licence
CC BY 4.0, three at BY-SA
I

Work it through in the page

All 92 frameworks run in the browser: type into them, and your entries stay on the device and can be copied out as Markdown or printed. Nothing is uploaded and nothing is stored on a server. The 28 marked interactive have a template built for their shape, a grid, a canvas, a scoring sheet or a rating; the rest have a worksheet built from the entry's own steps.

II

Every sheet

Each one links through to the full entry: what the framework is for, how to run it, a worked example, and an honest account of when it is the wrong tool.

Strategy & competition

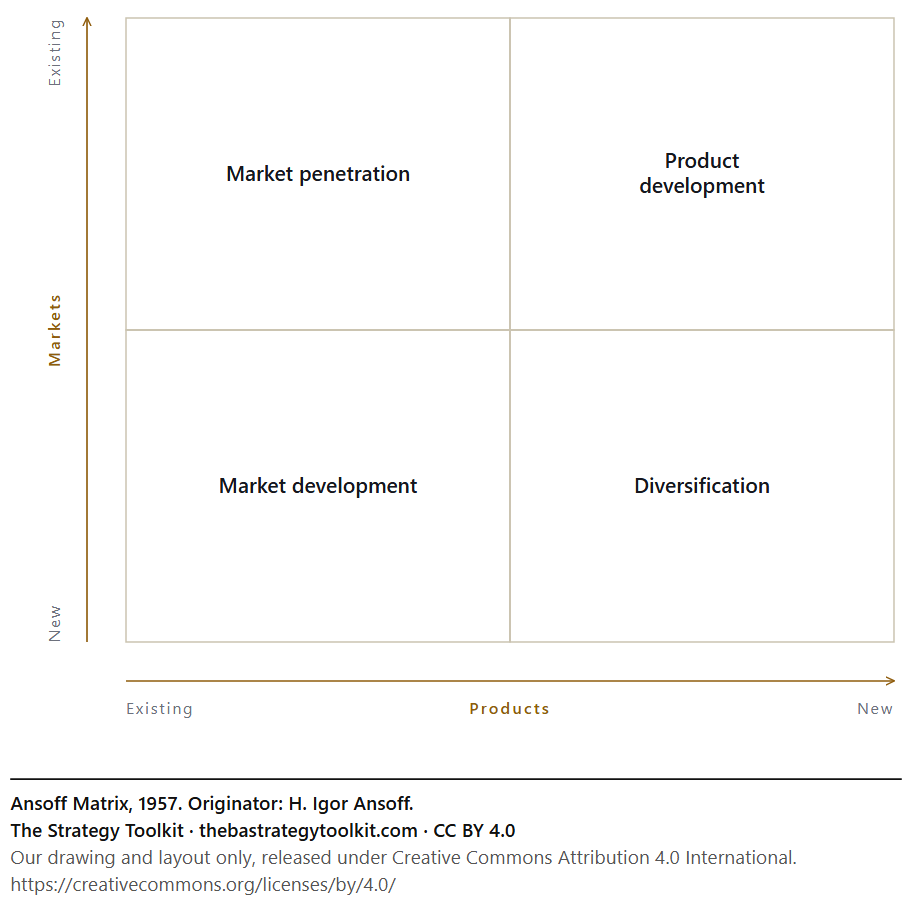
Ansoff Matrix diagram: Market penetration, Product development, Market development, Diversification.

Ansoff Matrix

For sorting your growth options by whether they take existing or new products into existing or new markets, each step riskier than the last. Leave it alone when the problem is defending what you have; this generates expansion, not defence. Instead Porter's Five Forces, which reads the pressure on the position you are defending.

CC BY 4.0·Download·Read the entry
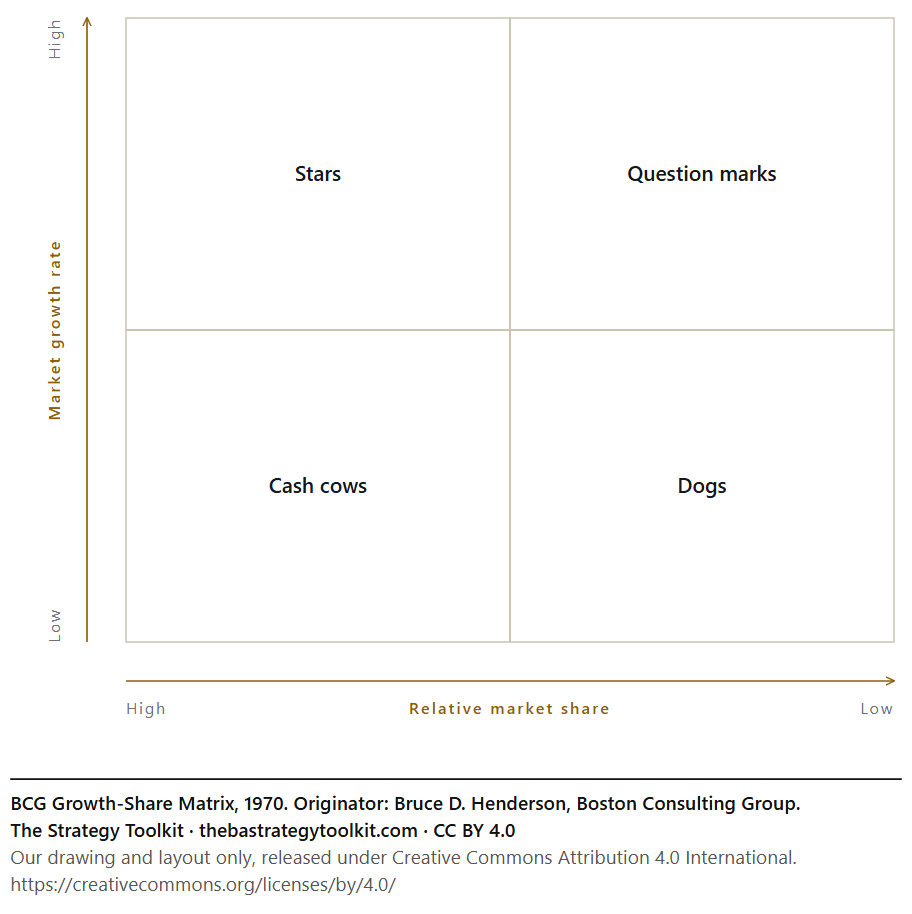
BCG Growth-Share Matrix diagram: Stars, Question marks, Cash cows, Dogs.

BCG Growth-Share Matrix

For deciding where a portfolio's cash should go, by plotting each business on market growth and market share. Leave it alone when you are one business in one market; there is no portfolio to balance. Instead Porter's Five Forces on the one business you have; a portfolio tool with one entry has nothing to say.

CC BY 4.0·Download·Read the entry
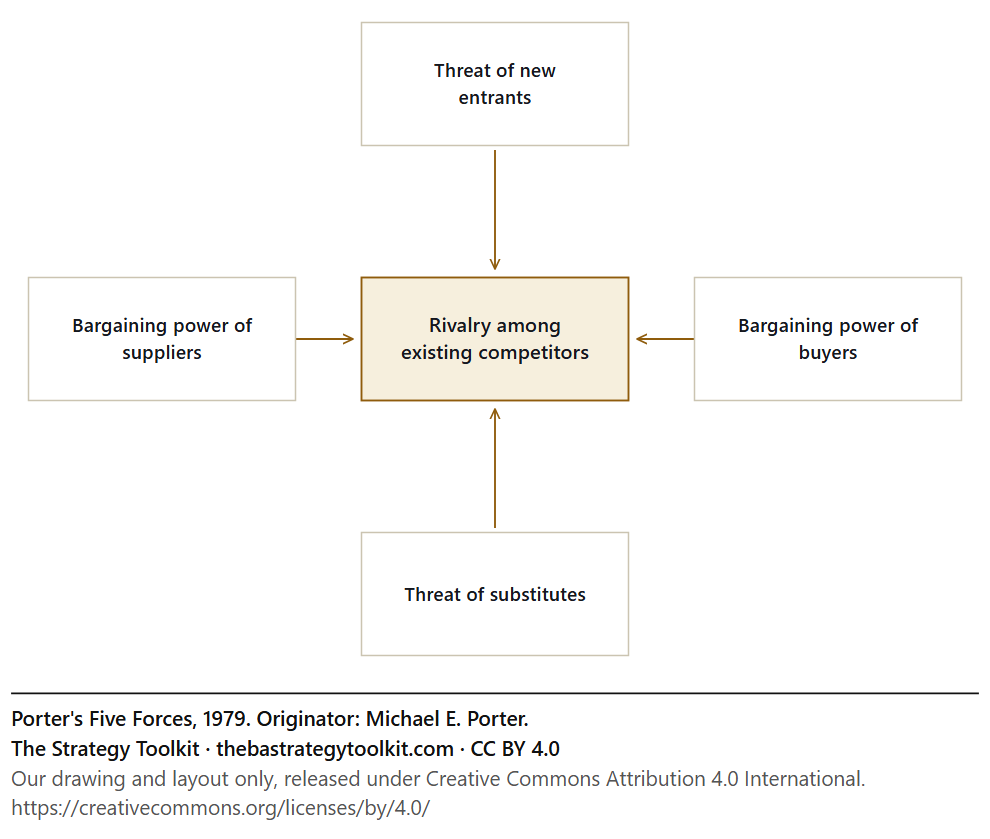
Porter's Five Forces diagram: Rivalry among existing competitors, Threat of new entrants, Bargaining power of suppliers, Bargaining power of buyers, Threat of substitutes.

Porter's Five Forces

For judging whether an industry can pay you, from the five forces that squeeze its profits, and where you could defend a position. Leave it alone when the question is about one competitor; this analyses the structure, not the rival. Instead 7 Powers, applied to the rival, to see what power they actually hold; Five Forces reads the structure, not the player.

CC BY 4.0·Download·Read the entry
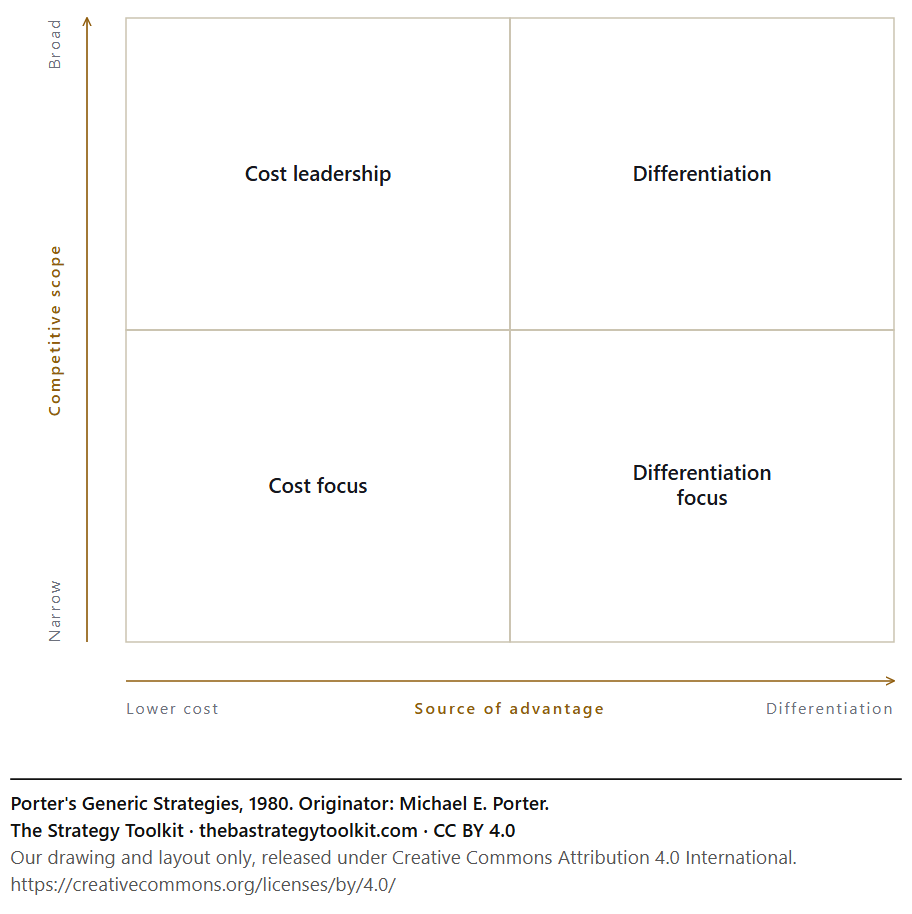
Porter's Generic Strategies diagram: Cost leadership, Differentiation, Cost focus, Differentiation focus.

Porter's Generic Strategies

For choosing, deliberately, whether you compete on cost or on difference, broadly or narrowly, and not getting stuck in the middle. Leave it alone when you have not yet analysed the industry; you would be choosing a position in a market you do not understand. Instead Porter's Five Forces first; you cannot choose a position in a market you have not read.

CC BY 4.0·Download·Read the entry
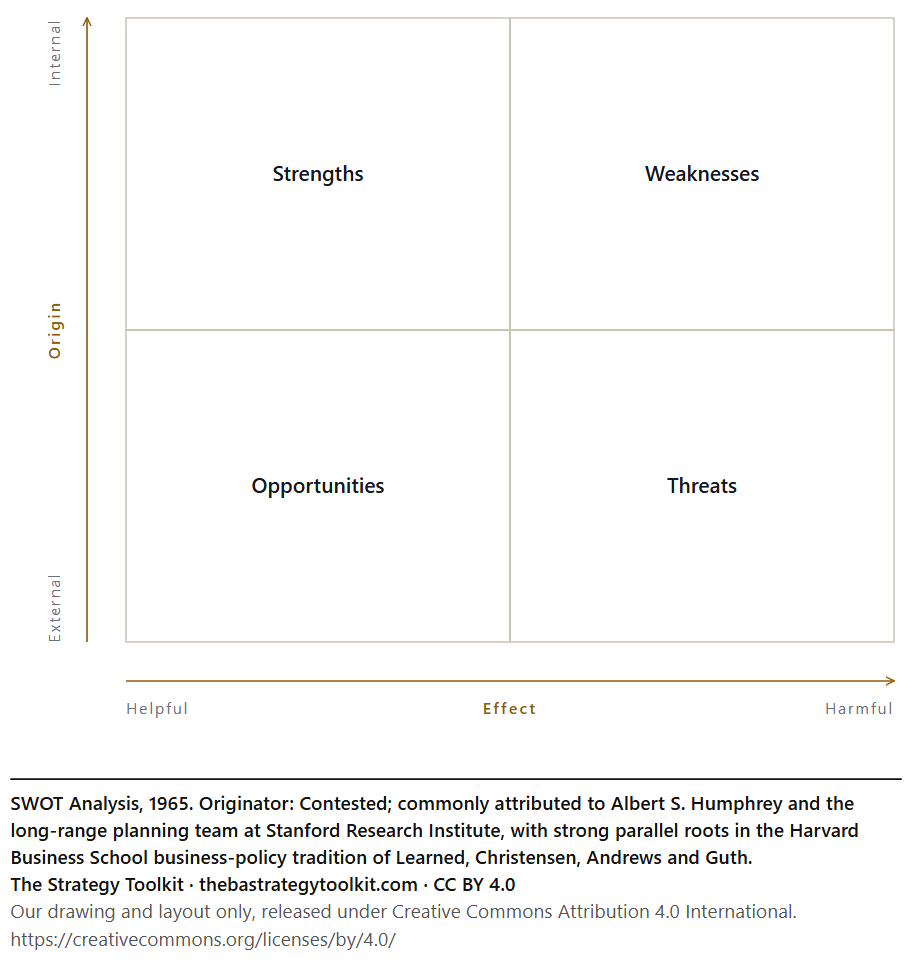
SWOT Analysis diagram: Strengths, Weaknesses, Opportunities, Threats.

SWOT Analysis

For getting a team's view of strengths, weaknesses, opportunities and threats onto one page, with evidence, before deciding anything. Leave it alone when you need decisions; it organises evidence and contains no way to choose. Instead TOWS, which turns the four lists into choices; SWOT only organises the evidence.

CC BY 4.0·Download·Read the entry
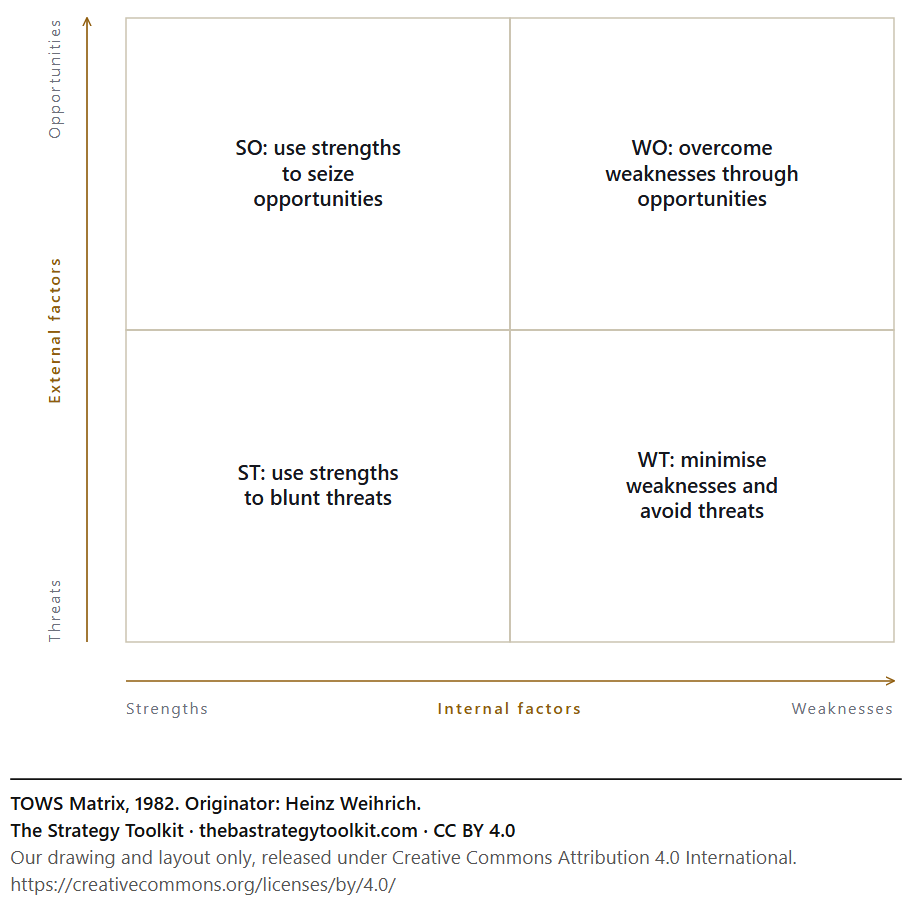
TOWS Matrix diagram: SO: use strengths to seize opportunities, WO: overcome weaknesses through opportunities, ST: use strengths to blunt threats, WT: minimise weaknesses and avoid threats.

TOWS Matrix

For turning a SWOT into strategy by pairing each strength and weakness with each opportunity and threat. Leave it alone when the SWOT underneath is thin or flattering; vague inputs give vague strategies. Instead Go back to the SWOT and make it honest; TOWS can only pair what it is given.

CC BY 4.0·Download·Read the entry
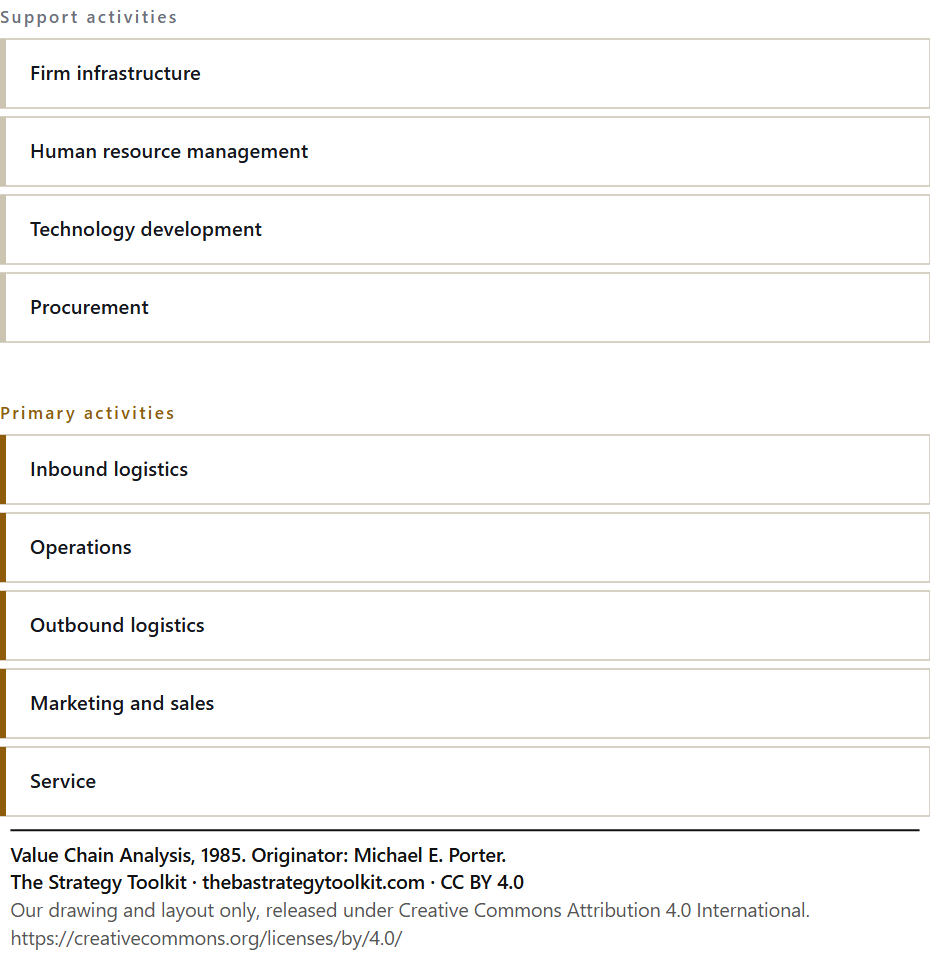
Value Chain Analysis diagram: Firm infrastructure, Human resource management, Technology development, Procurement, Inbound logistics, Operations, Outbound logistics, Marketing and sales, Service.

Value Chain Analysis

For finding where in your own activities cost is incurred and difference is created, because advantage lives in activities, not in the firm as a whole. Leave it alone when the question is about the industry around you; that is Five Forces. Instead Porter's Five Forces, for the industry around you; the value chain analyses your own activities.

CC BY 4.0·Download·Read the entry
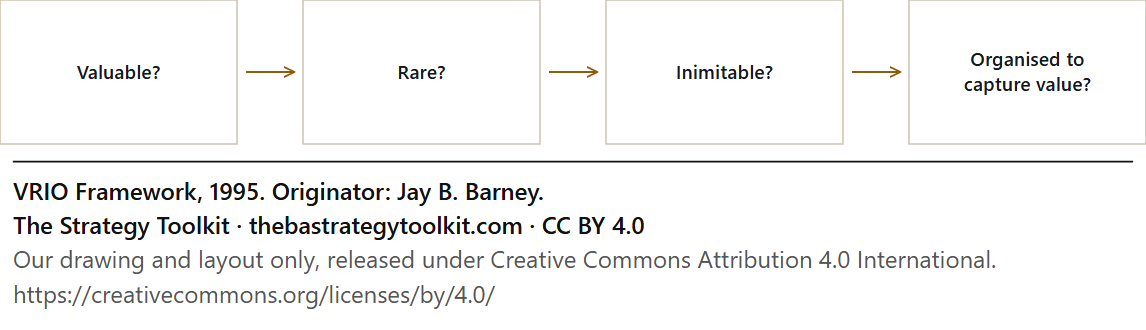
VRIO Framework diagram: Valuable?, Rare?, Inimitable?, Organised to capture value?.

VRIO Framework

For four tests for whether something you own is a real advantage: valuable, rare, hard to copy, and organised to exploit. Leave it alone when the question is about the outside world; this looks inward only. Instead Porter's Five Forces or PESTEL, for the outside world; VRIO only looks inward.

CC BY 4.0·Download·Read the entry
Marketing & customer

Innovation & product

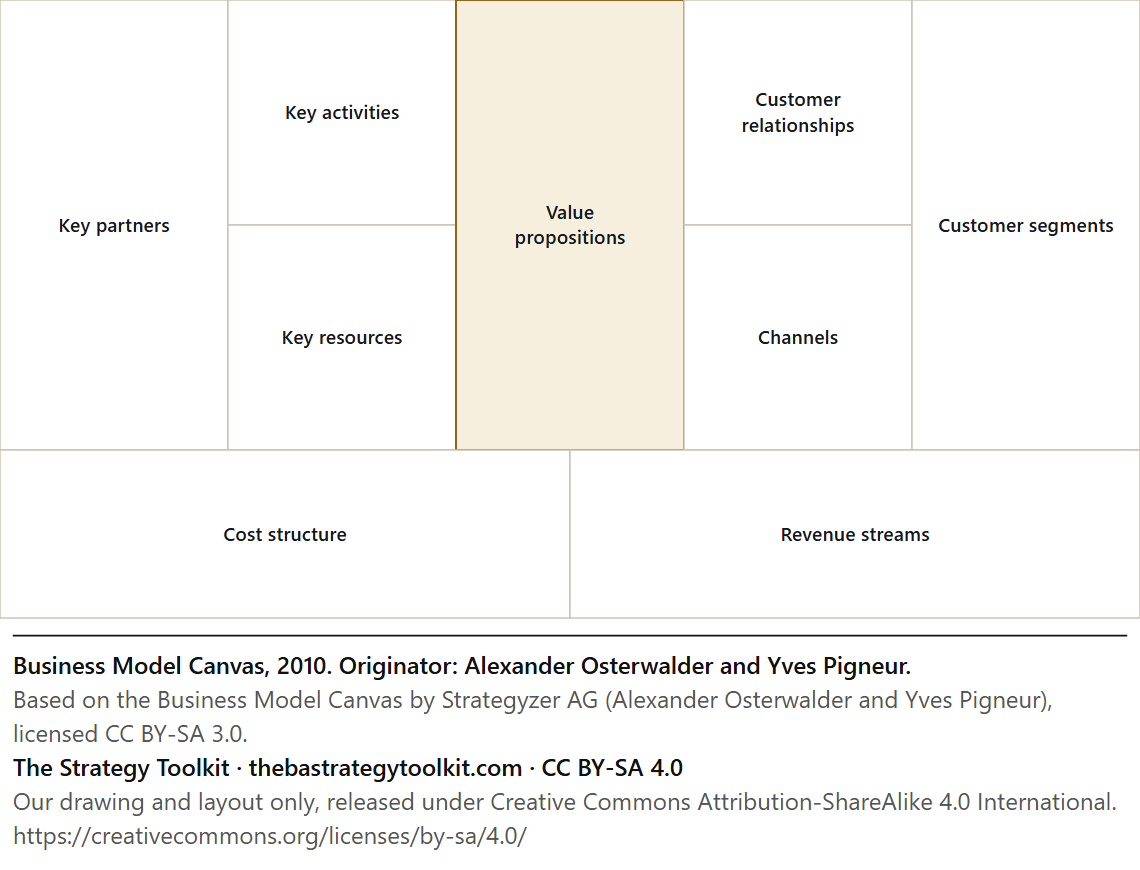
Business Model Canvas diagram: Key partners, Key activities, Key resources, Value propositions, Customer relationships, Channels, Customer segments, Cost structure, Revenue streams.

Business Model Canvas

For seeing a whole business on one page, from who it serves to what it costs, so it can be questioned and redrawn. Leave it alone when the question is about competitors or the industry; the canvas has no box for rivals. Instead Porter's Five Forces, for the rivals the canvas has no box for; PESTEL for the weather around them.

CC BY-SA 4.0·Download·Read the entry

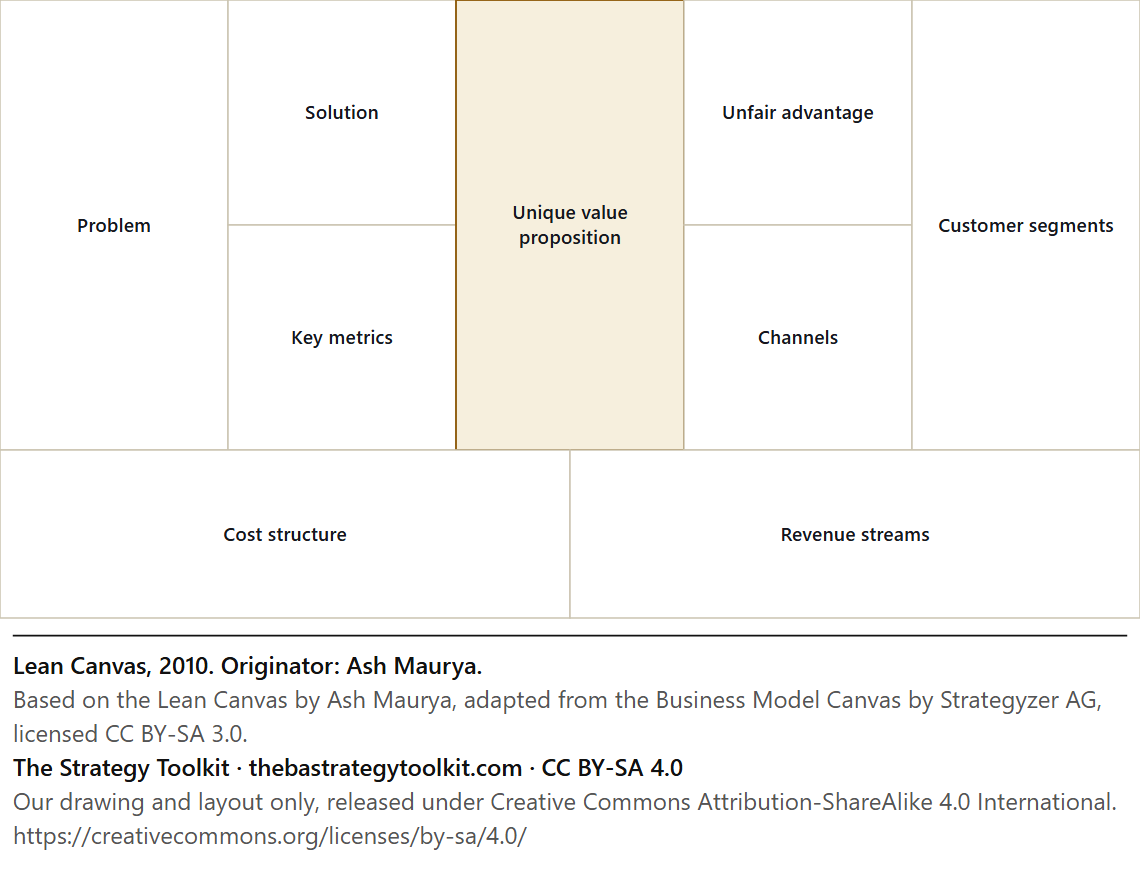
Lean Canvas diagram: Problem, Solution, Key metrics, Unique value proposition, Unfair advantage, Channels, Customer segments, Cost structure, Revenue streams.

Lean Canvas

For a one-page plan for a new venture that puts the riskiest assumptions, the problem, the solution, the unfair advantage, where you can see and test them. Leave it alone when the business is established with real partners and operations; the full canvas fits better. Instead The Business Model Canvas, which keeps the partners, channels and operations an established business has.

CC BY-SA 4.0·Download·Read the entry

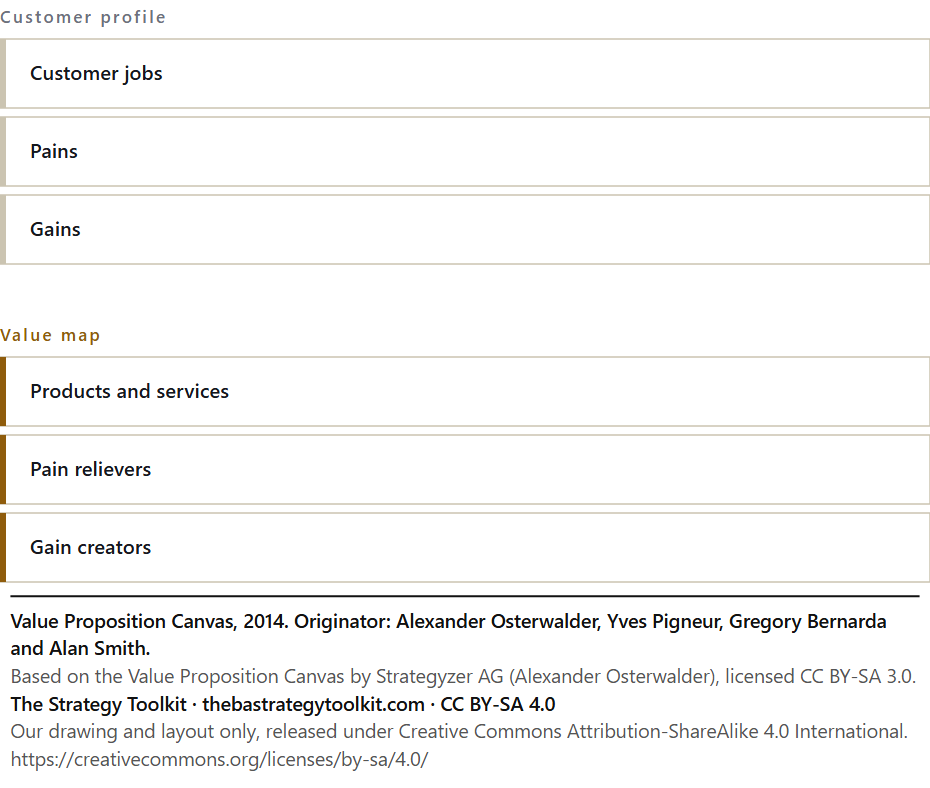
Value Proposition Canvas diagram: Customer jobs, Pains, Gains, Products and services, Pain relievers, Gain creators.

Value Proposition Canvas

For matching what one group of customers is trying to do, and what frustrates them, against what you offer and how it helps. Leave it alone when you are designing the whole business; this covers two of its nine blocks. Instead The Business Model Canvas, which covers the other seven blocks a whole business needs.

CC BY-SA 4.0·Download·Read the entry

Operations & process

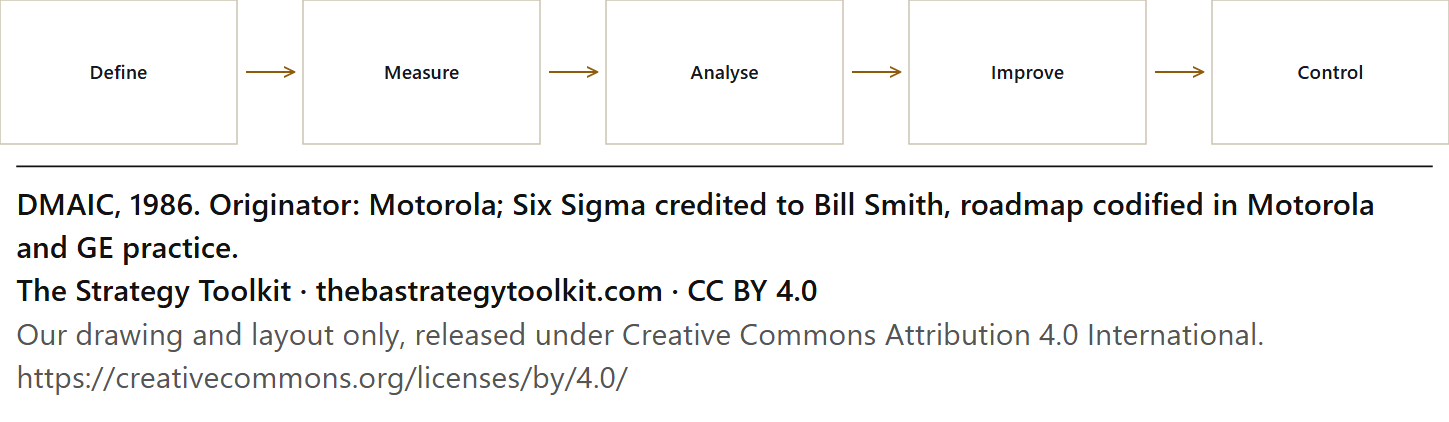
DMAIC diagram: Define, Measure, Analyse, Improve, Control.

DMAIC

For fixing a process that keeps producing defects, in five disciplined steps from defining the problem to holding the gain. Leave it alone when you already know the cause and the fix; replace the valve. Instead Replace the valve. A known cause with a known fix needs a work order, not a five-phase project.

CC BY 4.0·Download·Read the entry

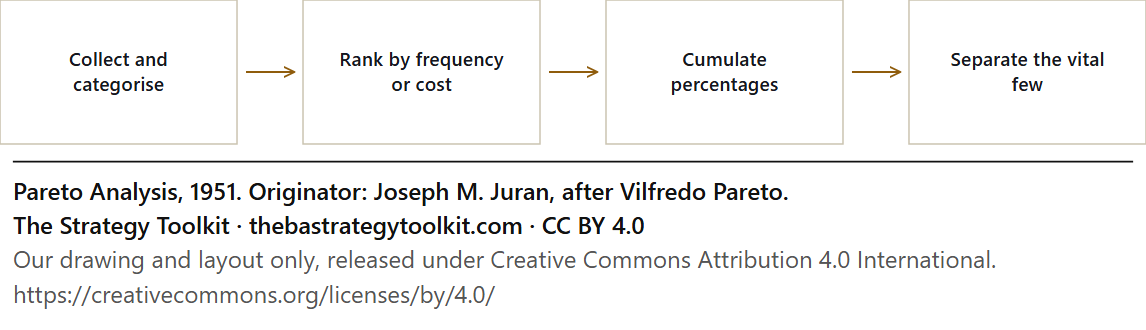
Pareto Analysis diagram: Collect and categorise, Rank by frequency or cost, Cumulate percentages, Separate the vital few.

Pareto Analysis

For finding the few causes behind most of the trouble, by ranking the losses and seeing where the weight sits. Leave it alone when the causes are all about the same size; forcing a vital few onto a flat spread invents a priority. Instead A Fishbone Diagram; when the causes are all the same size, look at how they connect rather than which is biggest.

CC BY 4.0·Download·Read the entry

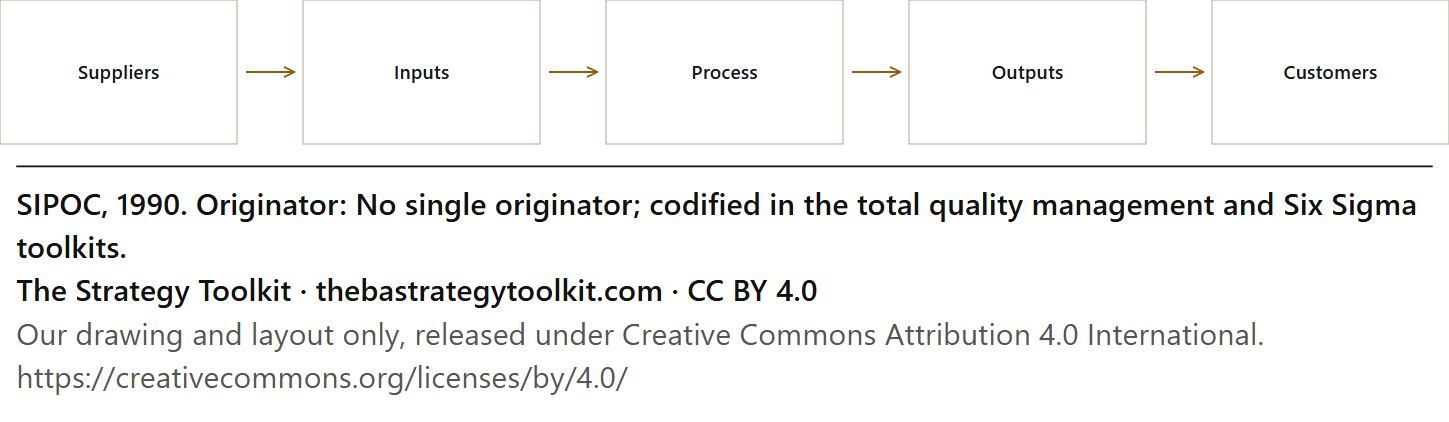
SIPOC diagram: Suppliers, Inputs, Process, Outputs, Customers.

SIPOC

For agreeing the boundaries of a process on one page, suppliers, inputs, steps, outputs and customers, before anyone argues about the detail. Leave it alone when you already need the detail, the times, the queues, the rework; use value-stream mapping. Instead Value Stream Mapping, which has the times, the queues and the rework that SIPOC leaves out.

CC BY 4.0·Download·Read the entry

Decision-making & prioritisation

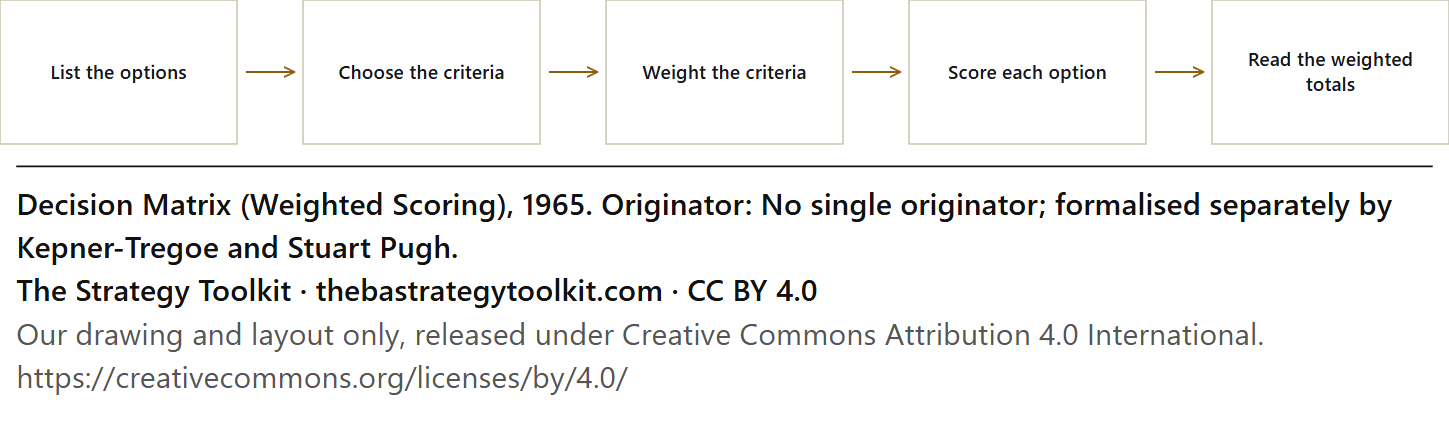
Decision Matrix (Weighted Scoring) diagram: List the options, Choose the criteria, Weight the criteria, Score each option, Read the weighted totals.

Decision Matrix (Weighted Scoring)

For choosing between options by agreeing what matters, weighting it, and scoring each option, so the reasoning can be seen and argued with. Leave it alone when one thing dominates; if price is everything, a blend only hides that. Instead Say which one thing matters and decide on it; Cost-Benefit Analysis if it is money, a Risk Matrix if it is safety.

CC BY 4.0·Download·Read the entry

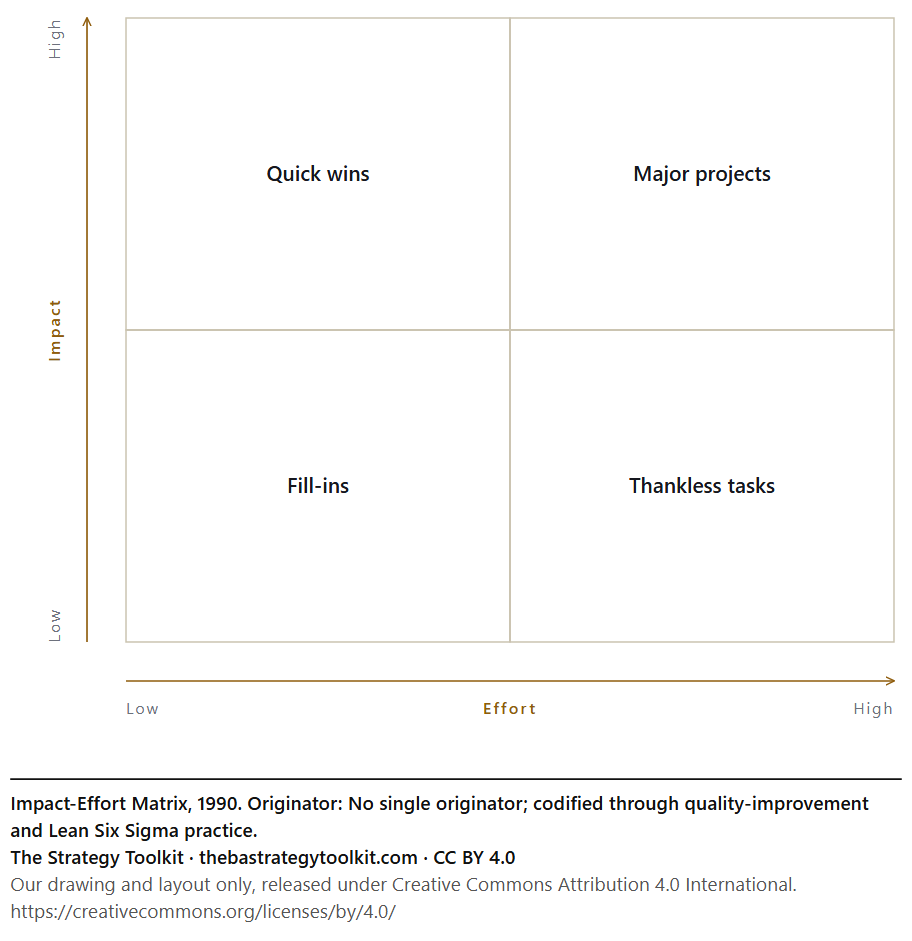
Impact-Effort Matrix diagram: Quick wins, Major projects, Fill-ins, Thankless tasks.

Impact-Effort Matrix

For finding the quick wins by sorting ideas by how much they would do against how much they would cost. Leave it alone when the decision is big or hard to undo; two gut-feel axes are too crude for that. Instead Cost-Benefit Analysis, with a Risk Matrix beside it; a big or irreversible call deserves more than two gut-feel axes.

CC BY 4.0·Download·Read the entry

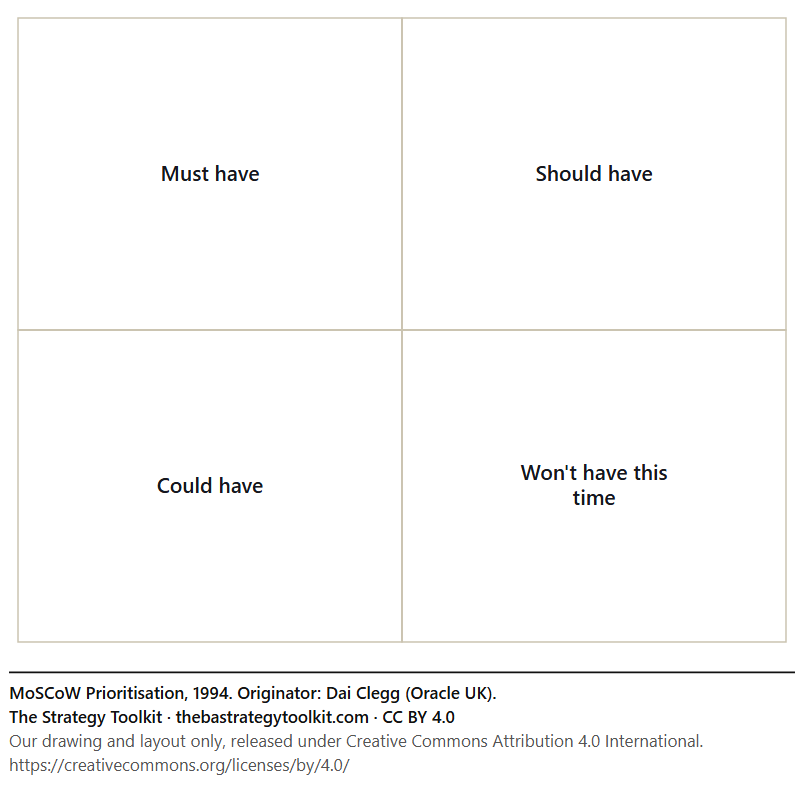
MoSCoW Prioritisation diagram: Must have, Should have, Could have, Won't have this time.

MoSCoW Prioritisation

For agreeing before a deadline what must be delivered, what should, what could, and what will not this time. Leave it alone when you need a rank order; this sorts into four bins and says nothing about the sequence inside them. Instead RICE, which ranks; MoSCoW only sorts into bins.

CC BY 4.0·Download·Read the entry

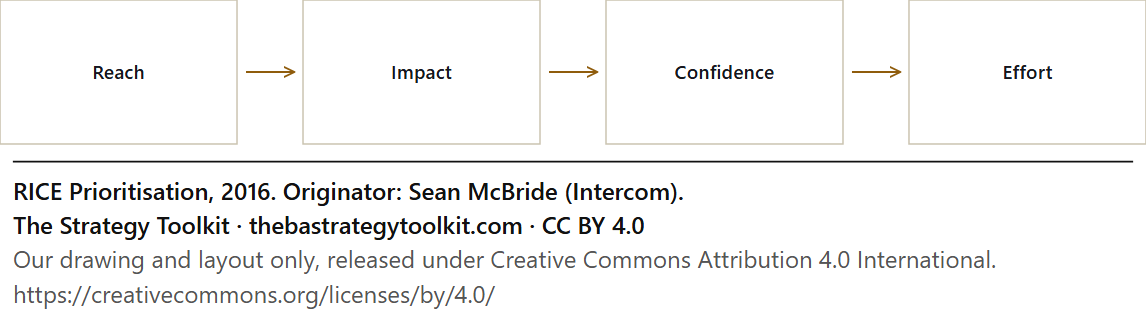
RICE Prioritisation diagram: Reach, Impact, Confidence, Effort.

RICE Prioritisation

For ranking competing ideas by reach, impact, confidence and effort, so quiet, valuable work can beat the loudest request. Leave it alone when the question is strategic rather than a list; it ranks, it does not set direction. Instead OKRs or Three Horizons, to set the direction; RICE only ranks a list against one.

CC BY 4.0·Download·Read the entry

Finance

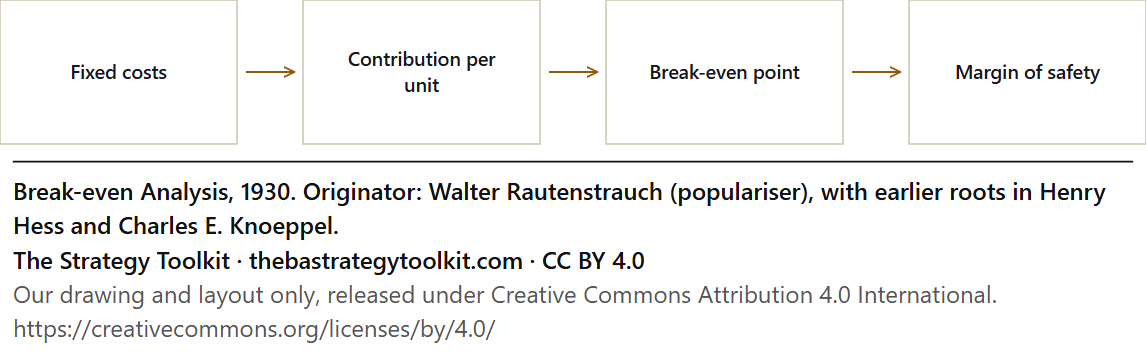
Break-even Analysis diagram: Fixed costs, Contribution per unit, Break-even point, Margin of safety.

Break-even Analysis

For finding how much you have to sell before you stop losing money, and how much room the plan has to be wrong. Leave it alone when costs cannot be split into fixed and variable, as in a business where every job is priced from scratch. Instead Unit Economics, job by job: what each one earns after what it costs to deliver.

CC BY 4.0·Download·Read the entry

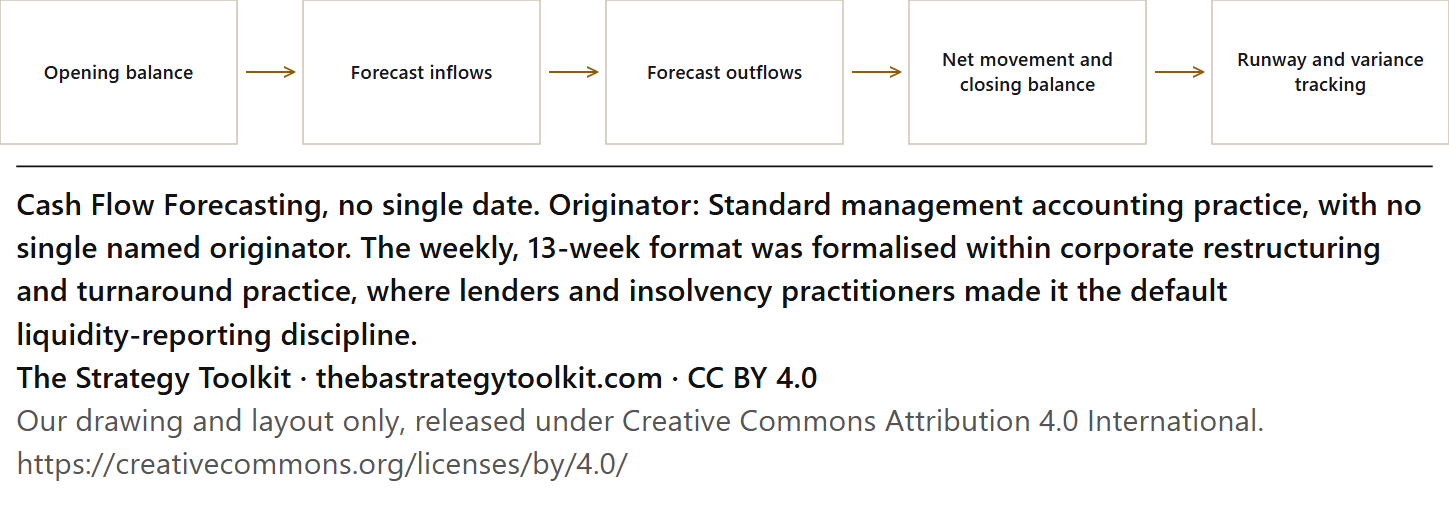
Cash Flow Forecasting diagram: Opening balance, Forecast inflows, Forecast outflows, Net movement and closing balance, Runway and variance tracking.

Cash Flow Forecasting

For seeing when you will run short of cash, month by month, even while the profit figures look fine. Leave it alone when you want to know whether you are profitable; this measures cash, not profit. Instead Financial Ratio Analysis, which reads profit from the accounts; the forecast only tells you whether you can pay the bills.

CC BY 4.0·Download·Read the entry

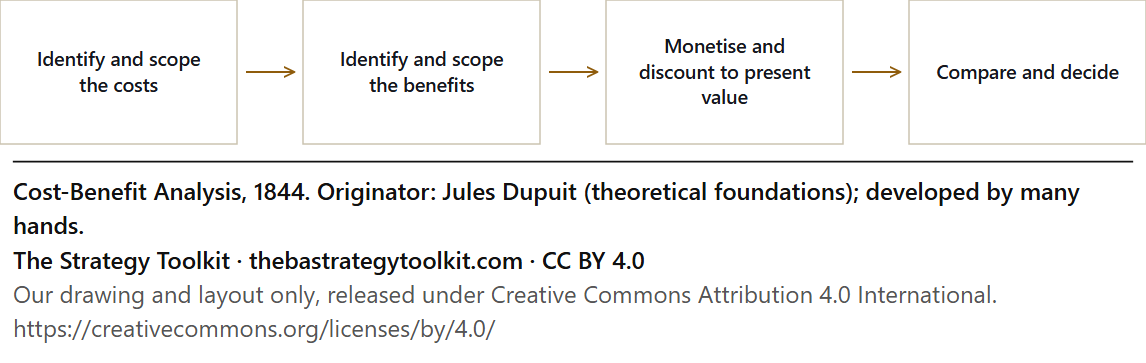
Cost-Benefit Analysis diagram: Identify and scope the costs, Identify and scope the benefits, Monetise and discount to present value, Compare and decide.

Cost-Benefit Analysis

For putting every cost and benefit of a proposal into today's money and comparing the totals. Leave it alone when what matters most cannot be priced, such as reputation or safety; forcing it produces confident nonsense. Instead A Decision Matrix, where reputation and safety can stay in their own units instead of being forced into pounds.

CC BY 4.0·Download·Read the entry

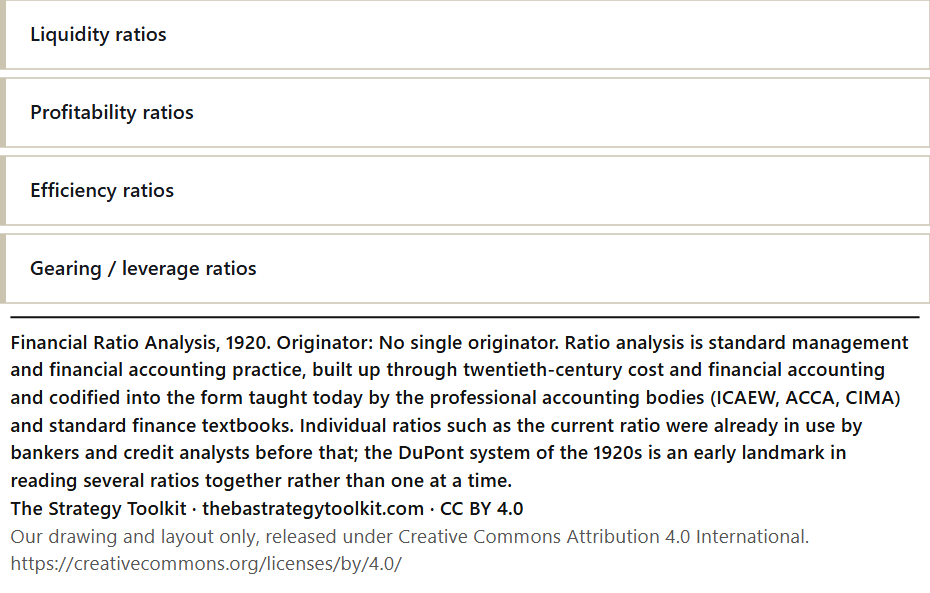
Financial Ratio Analysis diagram: Liquidity ratios, Profitability ratios, Efficiency ratios, Gearing / leverage ratios.

Financial Ratio Analysis

For reading a set of accounts to answer two questions: can we afford this, and is the business actually healthy? Leave it alone when the business has traded for less than a year and there is nothing clean to compare. Instead Cash Flow Forecasting; in the first year the question is whether you will still be trading, not how the ratios compare.

CC BY 4.0·Download·Read the entry

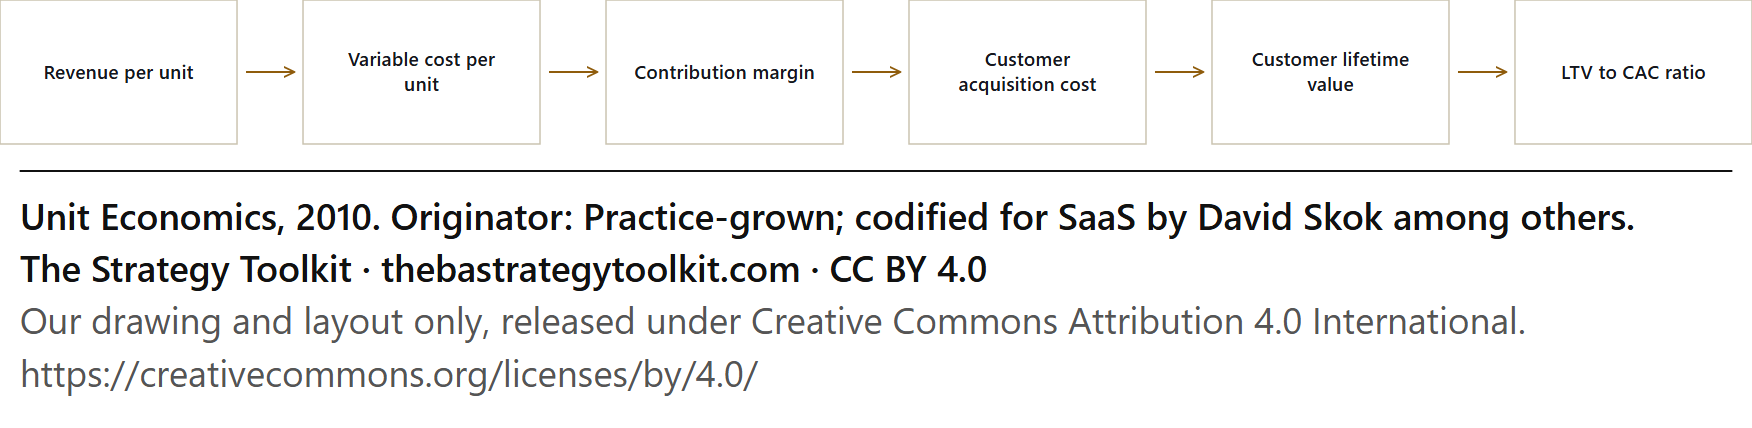
Unit Economics diagram: Revenue per unit, Variable cost per unit, Contribution margin, Customer acquisition cost, Customer lifetime value, LTV to CAC ratio.

Unit Economics

For checking whether each sale and each customer actually makes money, before you scale and multiply the loss. Leave it alone when you have too little history to know how long customers stay; three months of data is a guess with a decimal point. Instead Break-even Analysis and Cash Flow Forecasting until you have a year of customers; lifetime value needs a lifetime.

CC BY 4.0·Download·Read the entry

Org, people & execution

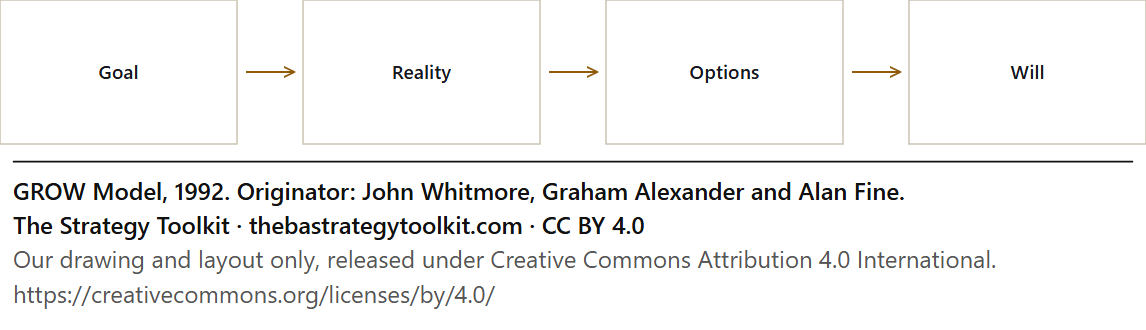
GROW Model diagram: Goal, Reality, Options, Will.

GROW Model

For running a coaching conversation that leaves the other person owning the answer: goal, reality, options, will. Leave it alone when the person lacks the skill; questions cannot conjure knowledge, so teach first. Instead Situational Leadership; a skill gap wants telling and showing before it wants asking.

CC BY 4.0·Download·Read the entry

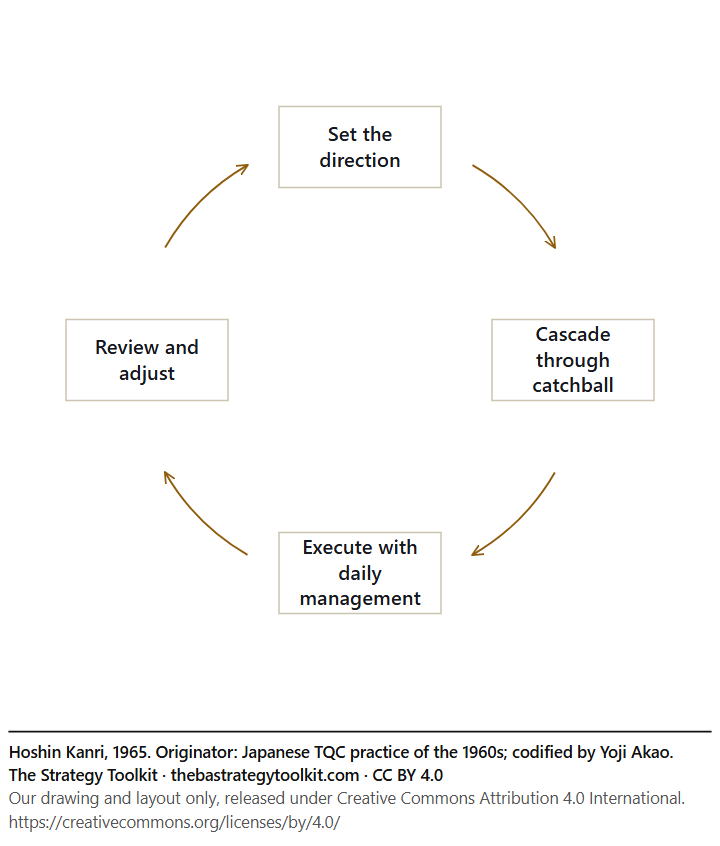
Hoshin Kanri diagram: Set the direction, Cascade through catchball, Execute with daily management, Review and adjust.

Hoshin Kanri

For turning a few breakthrough objectives into aligned targets at every level, negotiated up and down rather than handed down. Leave it alone when the direction is undecided; this deploys a strategy, it does not produce one. Instead Playing to Win, to decide the direction; hoshin only deploys one you already have.

CC BY 4.0·Download·Read the entry

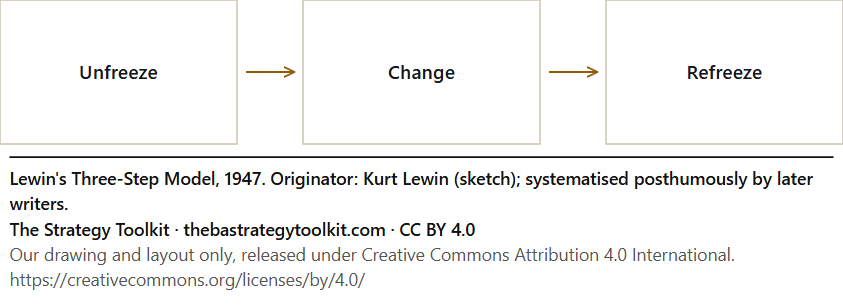
Lewin's Three-Step Model diagram: Unfreeze, Change, Refreeze.

Lewin's Three-Step Model

For the simplest picture of change there is: loosen the current way, move, then settle the new way so it does not snap back. Leave it alone when your organisation must change continuously; settling is the wrong ambition. Instead Kaizen and PDCA, built for change that never settles; refreezing is the wrong ambition.

CC BY 4.0·Download·Read the entry

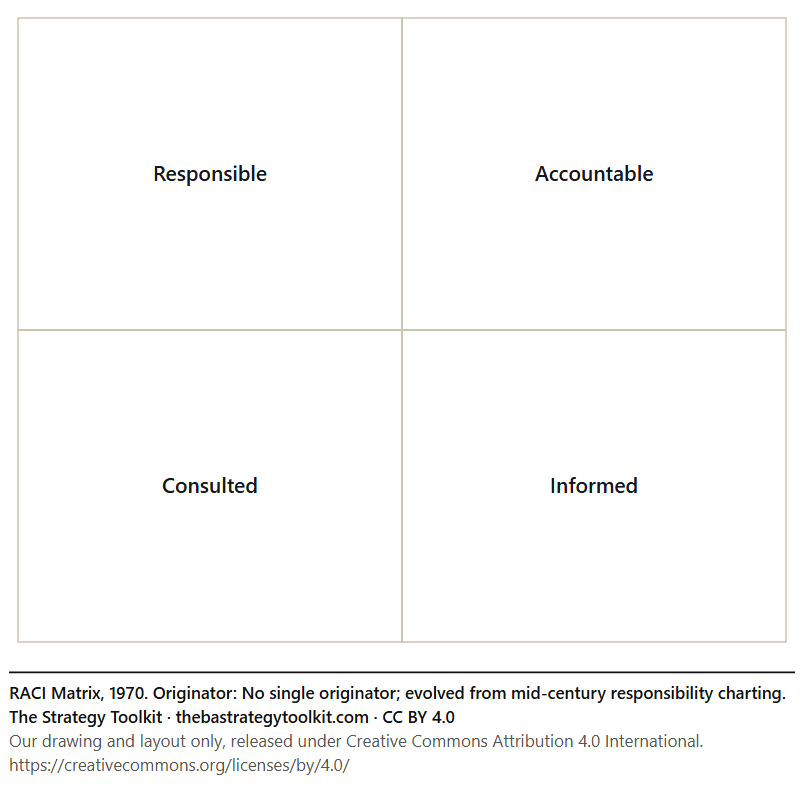
RACI Matrix diagram: Responsible, Accountable, Consulted, Informed.

RACI Matrix

For settling who does the work, who is accountable, who is consulted and who is told, for every task that matters, with exactly one accountable name each. Leave it alone when the team is small and stable and everyone already knows; it adds admin, not information. Instead Nothing. A small, stable team that already knows who does what needs no chart.

CC BY 4.0·Download·Read the entry

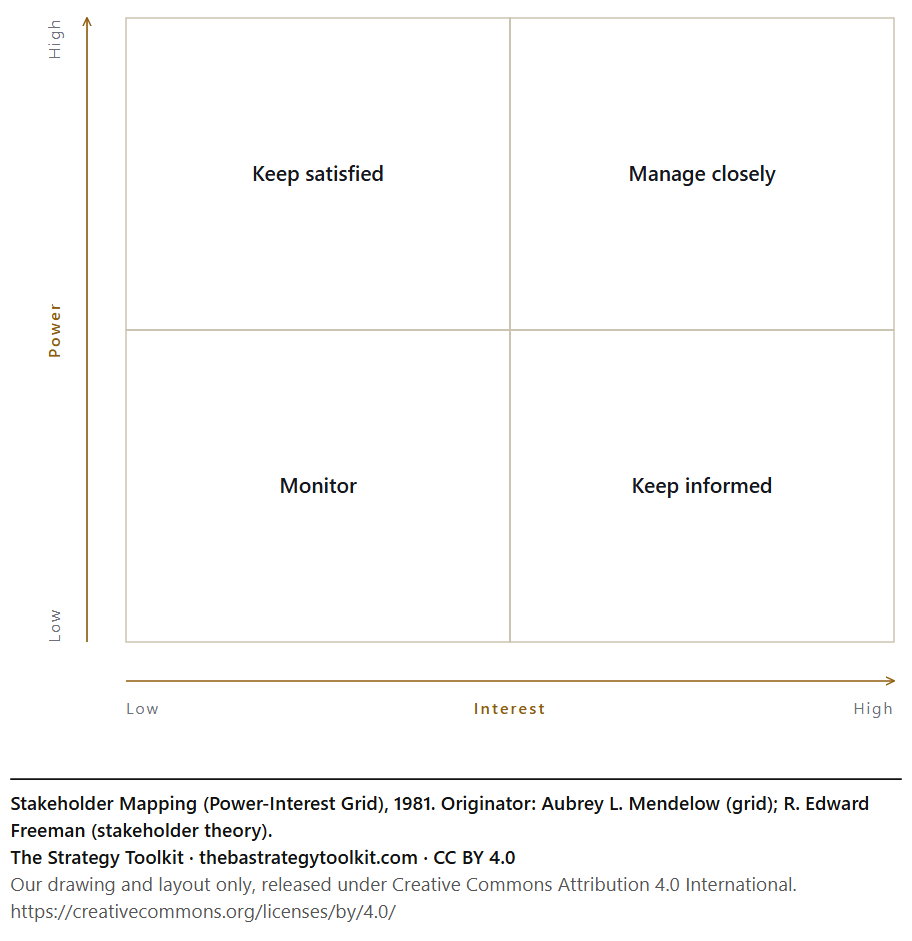
Stakeholder Mapping (Power-Interest Grid) diagram: Keep satisfied, Manage closely, Monitor, Keep informed.

Stakeholder Mapping (Power-Interest Grid)

For plotting everyone with a stake in your work by their power and their interest, and deciding how to engage each. Leave it alone when you would do it once and file it; power and interest move, and a stale map feels like diligence. Instead The same map, redrawn at each stage; power and interest move, and a stale map only looks like diligence.

CC BY 4.0·Download·Read the entry

Risk

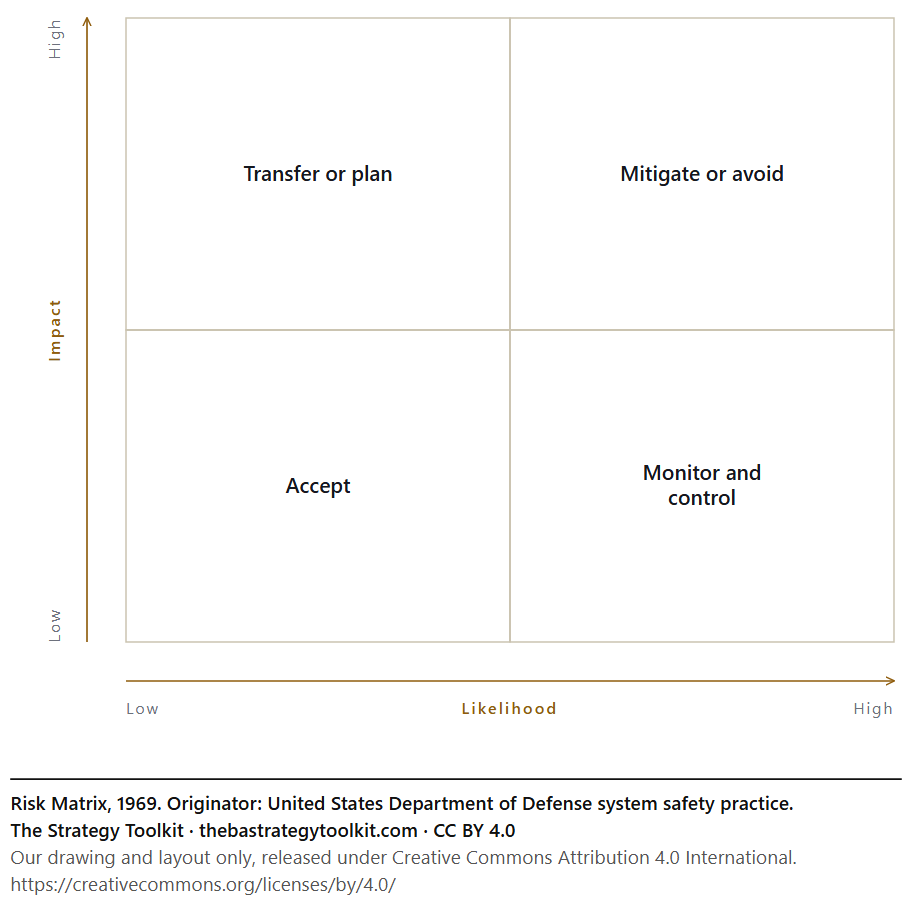
Risk Matrix diagram: Transfer or plan, Mitigate or avoid, Accept, Monitor and control.

Risk Matrix

For putting every risk on a grid of how likely and how bad, so attention and money go to the ones that are both. Leave it alone when the decision turns on precise quantities, such as reserving or insurance; a grid cannot carry that weight. Instead Quantitative risk analysis by someone qualified; reserving, insurance and safety cases need numbers, not a grid.

CC BY 4.0·Download·Read the entry
Governance

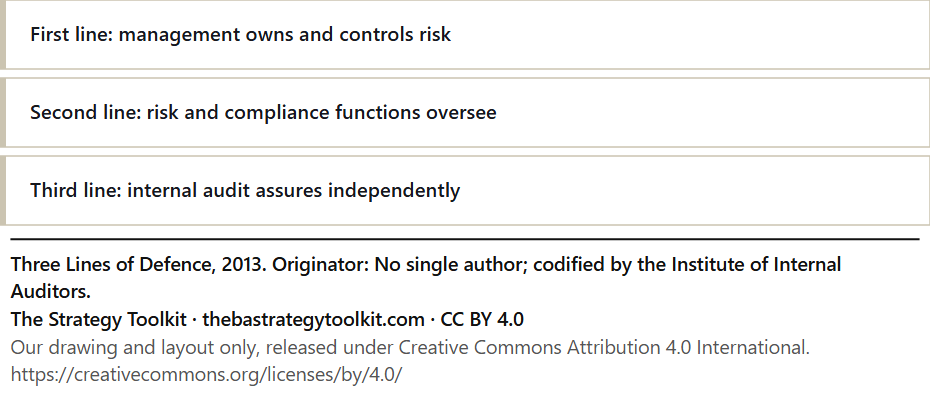
Three Lines of Defence diagram: First line: management owns and controls risk, Second line: risk and compliance functions oversee, Third line: internal audit assures independently.

Three Lines of Defence

For separating the people who run the risks from the people who check them, and both from the people who assure the board. Leave it alone when the organisation is small enough that all three lines would be the same two people; keep the principle, drop the structure. Instead RACI, to keep doing and checking in separate hands when the three lines would be the same two people.

CC BY 4.0·Download·Read the entry
III

Using these in your own work

Yes, you can use them commercially. Yes, you can put them in a deck you charge a client for. Yes, you can change them. Keep the attribution line on the sheet and you have met the licence. The licence page says all of this in plain English, including the three canvases that carry a slightly different licence because their originals do.

Browse all 92 frameworksNot sure which you need?